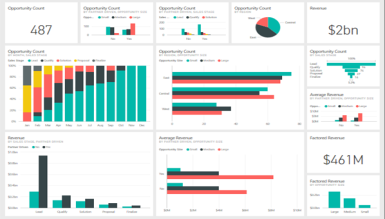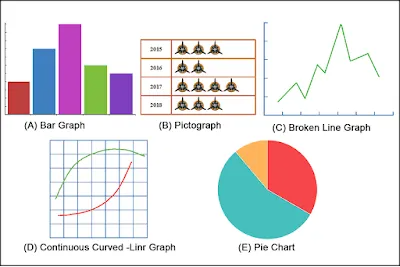
Dashboards


Geographic Information Systems (GIS)

Graphs & Charts

Reports


Consultation

Also we provide the following services:
◉ We will teach you how to use tableau, powerbi, domo, qlik sense
◉ We will help you to create tableau, power bi, excel, looker data studio dashboard
◉ We will do excel, google sheets, power bi, data studio dashboard, data analysis, pivot, chart
◉ We will create professional power bi dashboard and reports from any data source
◉ We will create dashboard, pivot table, and data visualization
◉ We will create professional excel dashboard
◉ We will create visualization charts and graphs of your data
◉ We will create interactive dynamic dashboard for project management in excel
◉ We will create interactive dynamic dashboard for project management in excel
◉ We will create google data studio dashboards report for data analytics visualization
◉ We will provide 1 hour of d3 js consultation
◉ We will do data analysis and create excel dashboards
◉ We will create excel dashboard, pivot table, charts with slicer
◉ We will be your data analyst and visualization expert
◉ We will data analytics visualization power bi tableau gds dashboard
◉ We will do mapbox, leaflet, google maps API, interactive map, and web gis application
◉ We will create power bi reports for data analysis and data visualization
◉ We will create professional google looker studio dashboards, tailored to your needs
◉ We will create interactive dashboards with streamlit and plotly dash
◉ We will do gis and remote sensing analysis
◉ We will do mapbox, leaflet, google maps API, interactive map, and web gis application
◉ We will do spatial analysis and mapping in arcgis pro qgis arcmap
◉ We will create google sheets or airtable interactive maps
◉ We will do geocomputation works with r
◉ We will do any task related to google earth, arcgis or qgis
◉ We will be your geospatial data analyst and web gis developer
◉ We will create plugins and automate qgis with python
◉ We will visualize your excel map data on a heat map
◉ We will create gis maps on arcgis, qgis, erdas imagine for you
◉ We will create a powerpoint map for your presentation
◉ We will develop interactive and responsive maps for web
◉ We will create maps,dem,3d models from google earth pro
◉ We will perform hydrological modeling and simulation
◉ We will create maps, shapefiles, and digitization of maps
◉ We will do gis and satellite image analysis, remote sensing analysis
◉ We will create custom reports for fishbowl inventory system
◉ We will create crystal report for you according to specifications
◉ We will check your vehicle history by carfax
◉ We will do sentiment analysis and data coding
◉ We will create excel financial models, forecasts, budgets, business plans
◉ We will design your solar energy pv system via pvsyst software
◉ We will build excel budget, project, sales planner and tracker
◉ We will do statistical research analysis, data analysis, statistics
